Cormac Staunton: Yogi Berra, the great American Baseball player who died last week at the age of 90, is credited with the immortal line: “It’s like déjà vu all over again”. In the wake of “Ireland’s Great Wealth Divide” on RTE last week, the recurring debate around inequality statistics in Ireland continues.
Part of the problem is complexity. While there have been many efforts to create single indicators that summarise economic inequality (such as the Gini coefficient), these have in turn only led to more discussion around how best to measure the distribution of economic resources.
Here I just want to address some of the issues that have arisen in response to my own take on this.
There are three important things to remember when discussing inequality statistics:
- Comparing individual indicators across countries, or with averages, is useful - but also fraught. Countries have different economic and social systems where inequality manifests itself in different ways.
- Inequality of market incomes (‘gross’ income inequality - before taxes and transfers) is an important indicator of underlying inequality – what we might usefully term ‘structural inequality’.
- Economic inequality is about more than incomes and wealth, which are only one way in which people meet their economic needs. Public services also play a key role in reducing inequality.
This is why the TASC report on economic inequality in Ireland “Cherishing All Equally” did not rely on single measures. The report looked at a whole of range of data, and brought the analysis down to 16 Key Indicators (with a total of 20 data points) (see Table).
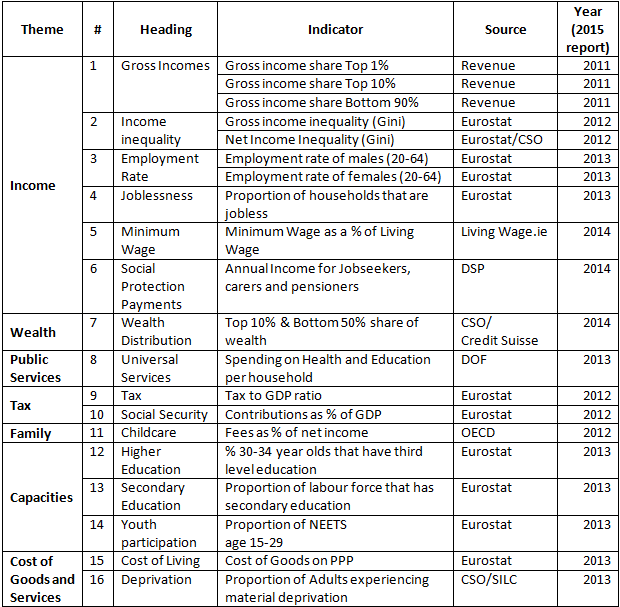 |
| Indicators of Economic Inequality - Cherishing All Equally |
Long term trends
Part of the critique of the inequality debate is that there is no evidence of a long term trend of rising inequality in developed countries. To be clear – there is, it’s just that it involves a lot of different indicators, from different sources, for a lot of countries, over a long time frame.
Of course, economic inequality does not look the same in every country, and there are exceptions. For example, unlike many countries, Ireland has had stable (and slightly falling) net-income inequality (after taxes and transfers) since the mid-1980s – but our gross income inequality (before taxes and transfers) has risen significantly to the point it is the highest in the OECD (more on that later). Nordic countries have had stable or falling gross income inequality, but they are now experiencing rising net-income inequality.
These differences do not mean that rising inequality is not an issue. Nor should the fact that Ireland is unusual in some measures discount the fact that we are subject to the same forces that drive economic inequality as other countries.
Wealth Inequality
Another critique is that there is no evidence of rising wealth inequality in Ireland. Again there is data to show there is: a study for the Combat Poverty Agency by Brian Nolan in the early 90’s (using data from the CSO survey in 1987) showed that the Top 10% had 42% of net wealth.
The recent Central Bank/CSO Household Finance and Consumption Survey (HFCS) shows that the figure is now 53%. Similarly the share of net wealth held by the Top 1% has risen over that time from 10% to 14.7% (this will be examined in more detail in an upcoming TASC report on the Distribution of Wealth).
But again we need to be careful with relying on single indicators. Wealth inequality isn’t straightforward. The recent Eurozone Household Finance and Consumption Survey (HFCS) showed greater wealth inequality in ‘more equal’ countries such as Nordic countries and Germany.
Why? Because good public pensions, free higher education or generous student loans, unemployment insurance and affordable public healthcare can greatly reduce the need for people to accumulate financial assets. Social housing and better rental markets have the same effect on real assets.
As a result, those at the top accumulate for business and investment purposes, while those in the middle have less need to. Hence, inequality of wealth rises while the outcomes are arguably better for those on middle and low incomes.
Market income inequality a real worry for Ireland
For some commentators, the fact that Ireland has average net-income inequality (which has declined since the 1980s) is evidence that our system is working well. But to fully understand inequality it is very important that we look at why we are different from many other countries on this particular measure.
The reason for the decline in net income inequality over the last 30 years in Ireland is in large part due to rising real average wages (along with overall employment rates) from the 1980s to the mid-2000s. But we need to take care here not to fall into the same trap as the economist Simon Kuznets.
When writing on inequality in the 1950’s, Kuznets concluded - by studying data for the US from the period from 1913 to the 1949 - that capitalism will inevitably lead to greater equality as ‘the rising tide lifts all boats’. The data at the time backed up his conclusion, but the problem with Kuznets’ data is that it covered an exceptional period. As real wages have stagnated and inequality has risen in the US since the 1970s, his theory has been greatly undermined.
The growth that Ireland experienced up to the late 2000s was exceptional (and arguably unsustainable). It was Ireland ‘catching up’ with the rest of the developed world. As we enter a phase of more steady growth we need to be careful not to make the same mistake that Kuznets did and assume that the trend of falling net-income inequality will continue.
The other reason we need to be careful is that Ireland performs well on measures of income redistribution because we have such high market inequality.
It may seem counter-intuitive but as IMF researchers have pointed out: more unequal countries tend to redistribute more. To put it another way, countries with lower structural inequality redistribute less - precisely because they are more equal to begin with.
Ireland has the highest rate of gross-income inequality in the OECD. Social welfare payments reduce Ireland’s income Gini from 0.58 (pre-tax and welfare) to 0.3 (post welfare). It’s the 0.58 we should be concerned about.
 |
| Market Income Gini - Source: OECD |
So with a very unequal starting point and a system focused on cash we see that Ireland works very hard – and yet we still end up with only average levels of net-income inequality. If we address our rising gross income inequality we can could achieve the same outcome with less effort, or indeed strive for greater equality with the same effort.
But… if ‘gross’ inequality continues to rise, the question is: how much harder does our tax and social welfare system have to work? How much harder can it work in order for it not to have negative economic consequences?
Public services
One of the key indicators in TASC's analysis of economic inequality is the level of taxation and government expenditure. In short - universal provision of public services such as healthcare, education, childcare, pensions, housing, public transport – leads to lower economic inequality.
Ireland currently has the third lowest government revenue in EU. Recent data confirm that there is no plan to reverse this and that Ireland will continue to have a low-tax, low public service economy into the near future.
 |
| Government Expenditure as % of GDP, GNP and IFAC Hybrid - Source: NERI |
Discussions about data are useful and long may they continue. But to paraphrase Desmond Tutu: its all very well to count how many people we are pulling from the river: but at some point we also have to understand why they are falling in.
Cormac Staunton is Senior Policy Analyst at TASC. You can follow him on Twitter @Cormac_Staunton
Cormac Staunton @cormac_staunton

Cormac Stauton is currently a policy advisor on EU and international policy in the Central Bank of Ireland. Prior to this, he was a policy analyst in TASC, and co-authored the first economic inequality report, Cherishing All Equally.
Share:

![Duggan, Vic]](/assets/img/2017/04/1491994913319631_sq.jpg)
