Michael Burke: The ESRI’s latest research paper, ’Irish Government Debt and Implied Debt Dynamics: 2011-2015’ has received much coverage. Commentary has focused on the projected stabilisation of the overall debt in relation to the economy; the debt/GDP ratio or the debt/GNP ratio. From this, some more excitable commentary has suggested that this is a vindication of the broad-based attack on living standards, increased taxes on working people (but not on corporates) and public spending cuts euphemistically known as ‘austerity’ policies.
However, this last contention, that ‘austerity works’, is not supported by the authors’ findings themselves. To quote their own summary of their paper, ‘[Our projected debt ratios are] much lower than had been projected in official figures earlier in the year, partly because the cost of the bank recapitalisation was much lower than anticipated and also because of the reduction in EU interest rates’.
So, the lower projections are based on the lower level of bank recapitalisation and lower rates for bailout funds for those recapitalisations. According to the authors’ abstract of their own findings, none of the projected improvement is attributable to ‘austerity’ measures.
Quality of Forecasts
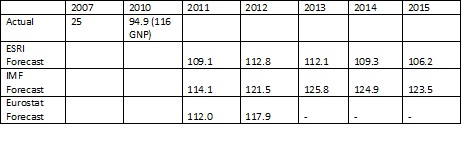
But how ‘good’ are these forecasts, in both senses? First, what is the quantum of improvement that is being forecast by the ESRI? Secondly, how likely is it that these forecasts will prove correct? The debt ratios forecast by the ESRI are set out in the table below:
Debt Ratios, % GDP
Source: ESRI, Eurostat, IMF databank, Euro Area Spring Forecasts
The first point to note is that the ESRI is not projecting any reduction in the level of government debt over the period 2010 to 2015. Over that period, debt will rise from 94.9% of GDP to a projected 106.2%. It is in effect projecting a deterioration in the debt level to next year, then stabilisation and then a reduction. Both the IMF and Eurostat forecasts are much worse.
This disparity is a function of two factors. First, the Eurostat and IMF forecasts were made before the reduction in interest rates and before the lower projections for the level of the bank bailout were made. Secondly, the ESRI has stronger real growth projections than either Eurostat or the IMF.
Before dealing with the substantial point of how large the bailout and interest rate savings are, it is worth highlighting the main source of the discrepancy in growth forecasts. In effect, ESRI has a much larger growth forecast of +1.8% real GDP in 2010 than either Eurostat (+0.6%) or the IMF (+0.5%). The difference arises because whereas the IMF and Eurostat both have prices rising by 0.6% in 2010 to reduce real GDP by that degree, the ESRI projects falling prices of 1.1% (implied from the gap between real and nominal GDP (Table 7). Given that deflation both reduces the nominal level of taxation revenues while also increasing the ratio of existing debt to nominal GDP, there can be little argument that this ‘stronger’ growth forecast is responsible for the ESRI’s more optimistic debt/GDP forecasts.
Instead, it is the combination of lower interest rates and a lower projected bank bailout cost which is responsible for the projections of a substantially improved debt outlook. On the former, the consensus appears to be that the annual saving will be in the order of €1bn per annum, perhaps slightly more. Implicitly the ESRI authors assume a saving of €1.125bn per annum, on the basis of a former interest rate of 6% (p.20, point 2.). Compounded, this saving over a 5 year period amounts to €8.5bn or approximately 4.6% of the GDP level projected for 2015.
On the lower bank bailout costs, the international bailout of creditors to Irish banks in November 2010 included €10bn of immediate bank recapitalisation plus another contingency amount of €20bn. To date, of this a total of €17bn has been provided by the State (banks funding €7bn themselves in the financial markets for a total of €24bn). The ESRI authors expect €3bn to be repaid to the State by 2014. This ‘saving’ of €13bn also incurs interest. However, the authors now argue that funding from the Troika will be needed in 2014, even though the terms of the original bailout were that the government would return to the financial markets in 2013. Therefore, there will be no net interest saving, based on the authors’ projections. Instead, there will be an additional cost of approximately €0.5bn (based on the 3.5% interest rate, rather than a projected interest rate of 6% in the financial market borrowings that are also assumed in the ESRI paper). As a result, the projected saving from a less onerous bank bailout is a net €12.5bn.
Taken together the actual interest rate saving of €8.5bn and projected saving on the bank bailout of €12.5bn combine for a total €21bn. This is equivalent to 11.4% of projected 2015 GDP.
Without these actual and projected windfalls, the ESRI forecast would otherwise have been 117.6% of GDP in 2015. This compares to a debt/GDP ratio of 94.9% in 2010.
Debt Dynamics
The idea that there will be no more bank bailouts has firmly taken hold and is largely responsible for the specific rally in Irish government debt in recent weeks. This is despite the fact that the EBA’s stress tests were widely discredited by the failure of two small Spanish banks shortly after publication, with total losses exceeding the EBA’s estimate of EU-wide recapitalisation requirements.
It may be the case that further losses do not require further recapitalisations. But the key exposure of the Irish banks is to the domestic economy, which continues to deteriorate on all forecasts, including those of the ESRI. This has an impact on the banking sector. Currently, this is most evident in the rise in the rate of mortgage defaults.
This highlights a key misconception regarding the relationship between the banking sector, government finances and the real economy. It is assumed that, if the banking sector is stabilised to the extent that it requires no further taxpayer funds, this will restore government finances to health, as long as public spending is reduced towards the level of taxation revenues (sufficient to provide a ‘primary surplus’, that is before interest payments are included). It is argued that, if all three occur, bank stabilisation, no more bailouts, a swing toward a primary surplus, then the crisis ‘will be over in 3 years’.
This is the premise that underlies a section of the ESRI paper dealing with debt dynamics. It is not denied that significant remedial action was required to resolve the crisis in the banking sector, even while many argue that a bailout of all their creditors was one of the least effective means of doing so. But, ever-greater contraction of the domestic economy can only be fatal to any ambitions to remove the banking sector from the life support it has been given by taxpayers. In effect, the ESRI and many others look through the world through the wrong end of the telescope. Neither banks’ balance sheets nor government finances can be restored to health until and unless there is an economic recovery.
The authors argue that, absent any further negative ‘shocks’, the debt/GDP ratio will begin to fall from 2013 onwards. The horizon for an imminent improvement never seems to alter. It is always 18 months hence. But the Irish economy received no external shocks in the way that economists use the term. The recession began here nearly a year before it began in the world economy, the slump in investment also a year earlier (which preceded the recession in both cases).
Three years ago in the Autumn 2008 Quarterly Economic Commentary the ESRI was forecasting a general government debt of 47.5% of GDP in 2009 and was fully supportive of government efforts to cut the deficit, in particular urging cuts in public sector pay. But this contractionary fiscal policy was a shock to the economy and the effect was slower growth, rising unemployment and falling tax revenues.
In the event, the debt/GDP ratio was 65.6% of GDP, not 47.5% in 2009, even while the government implemented ‘austerity’ measures equivalent to 9.1% of GDP. In effect the ESRI was forecasting a near-term deterioration in the debt level followed by stabilisation and then reduction, based on ‘austerity’. In fact a trawl through the QECs since 2008 shows that this debt profile is what the ESRI has been forecasting since 2008.
The authors clearly haven’t asked themselves the key question, so we must: Why will it be different this time?
Share:


![Duggan, Vic]](/assets/img/2017/04/1491994913319631_sq.jpg)